Here is the workflow we use to turn that broad question into an AI visibility monitoring setup based on realistic prompts, repeated testing, and business context.
“Are we visible in AI?” is not one question
More clients are asking us how their brands appear in AI-generated answers, so we get the usual question: Are we visible?
But once we start discussing what they actually want to know, that one question quickly turns into four different ones:
- Would an AI platform recommend our brand?
- How often do we appear compared to competitors?
- What does AI say about us, and is that information accurate?
- Does our website or content get cited as a source?
These questions are related, but they do not measure the same thing.
A brand can be mentioned frequently and still be described inaccurately. A website can be cited without the brand being recommended. A competitor may appear more often, while your brand receives a stronger position when it does appear.
That is why we do not treat AI visibility as a single score.
Before measuring anything, we need to define which part of visibility we are trying to understand.
What happens when an AI platform answers a prompt?
AI-generated answers do not work like a stable list of search results.
The exact process differs between platforms, but a web-grounded answer roughly goes through several stages.
The platform receives the user’s prompt and starts with the information already available within the model. That initial knowledge can already introduce bias toward certain brands, sources, or commonly mentioned entities.
When web search is involved, the platform may then break the prompt into several related searches. This is usually referred to as query fan-out.
The system retrieves relevant passages from search results, filters and re-ranks them, and then generates an answer using a relatively small number of selected sources.
So, in simplified form, the process looks like this:
Input prompt → initial model knowledge → query fan-out searches → passage retrieval → re-ranking → grounded answer with a few citations
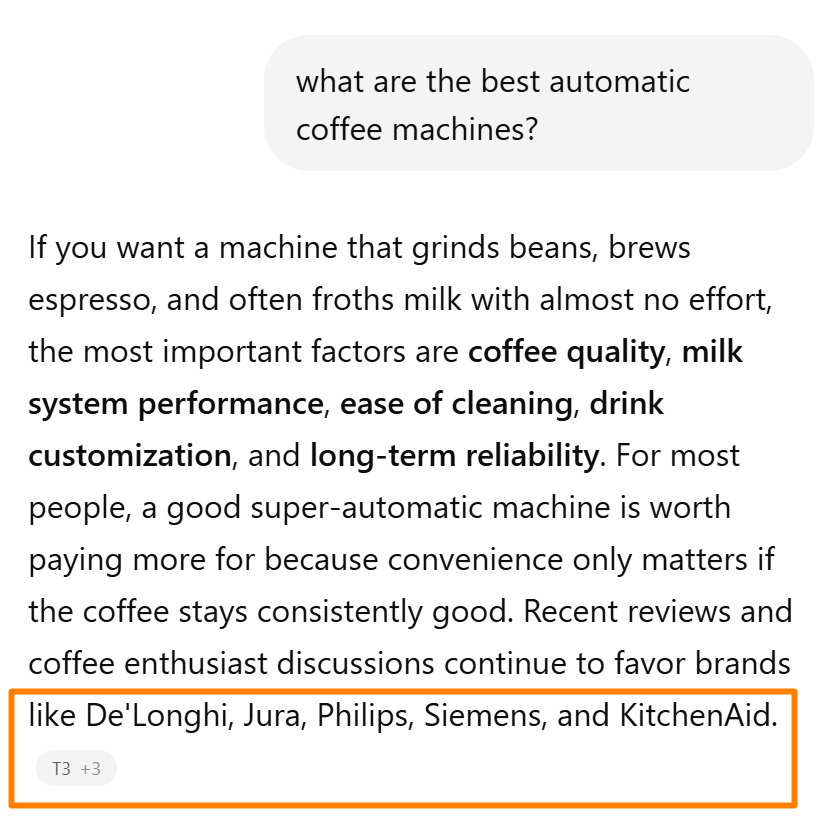
A single AI answer can mention several brands while relying on only a small set of cited sources
This matters because the final answer depends on more than traditional rankings: what the model already knows, which searches it generates, which passages it selects, and which sources survive the final filtering stage.
The same prompt can therefore produce different brand recommendations, rankings, descriptions, and citations across multiple runs.
One answer is not a dataset.
The AI visibility measurement problem
With Google Search, we can start with search queries, impressions, clicks, and search volume estimates.
We do not currently have the same kind of usable query-level demand data for AI platforms. There is no equivalent report showing how many times users asked ChatGPT, Gemini, or Claude a particular question during the previous month.
That makes synthetic prompt tracking the most practical way to monitor AI visibility.
In simple terms, we create a defined set of prompts, run them through selected AI platforms, and track how the answers change over time.
Many AI visibility tools already monitor large sets of pre-selected synthetic prompts. That is not useless, and it can provide a broad view of category visibility and general brand presence.
The problem is specificity!
Generic prompt sets often do not represent the products, markets, modifiers, comparison criteria, or customer questions that matter to a particular business. And if the prompt set does not reflect how people choose within your category, the resulting visibility score can be technically precise but practically irrelevant.
So, we build the prompt set around the business rather than starting with whatever prompts happen to be available in some SEO tool.
Our AI visibility monitoring workflow
1. Start with the data you already have
We do not start by asking an AI tool to generate hundreds of random prompts. Our existing sources already tell us something about customer demand and intent.
Google Search Console
Search Console contains queries people already use to find the website. These queries help us identify relevant products, problems, categories, use cases, and comparison terms.
They do not tell us exactly what people ask on AI platforms, but they show which topics already carry real search demand.
SEO keyword tools
Keyword research tools help expand the initial dataset with related topics, modifiers, alternatives, comparison terms, and product attributes.
This is especially useful when we need to cover different stages of the decision-making process rather than only the keywords for which the website already receives impressions.
Customer support
Customer support questions show how people describe their needs before making a decision.
These questions are often more conversational than traditional search queries, which makes them particularly useful when preparing prompts for AI platforms.
Search data tells us what people look for, but customer support often tells us how they ask. Together, these sources give us a grounded starting point for the prompt set.
2. Turn search queries into realistic prompts
Next, do not paste a keyword list into an AI visibility tracker. Search keywords need to be converted into questions that resemble natural AI interactions.
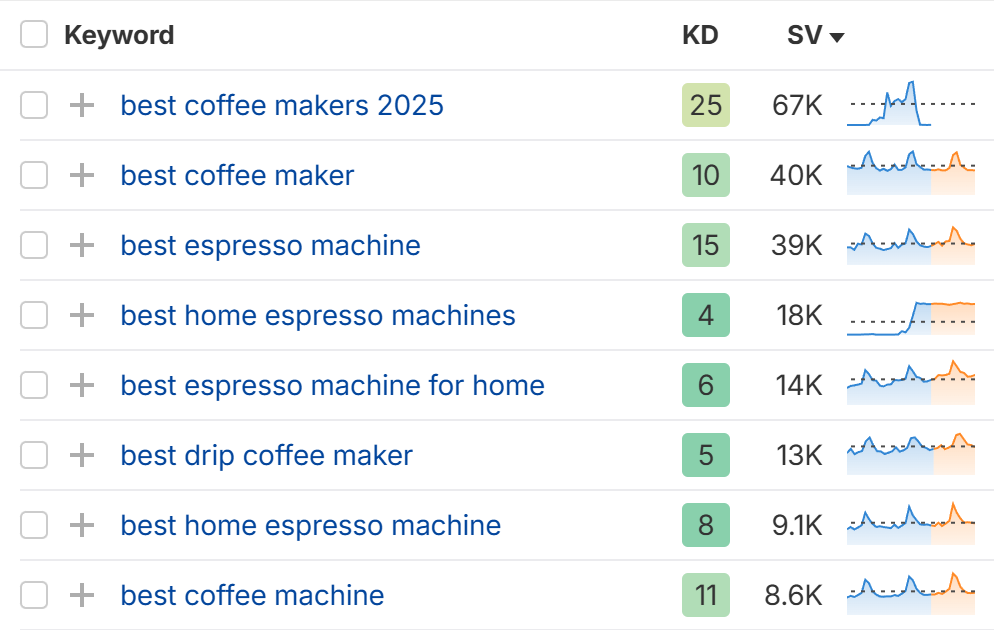
Keyword research helps identify the topics, modifiers, and comparison terms that should shape a realistic prompt set
For example:
Search query: best drip coffee maker
Prompt: What are the best drip coffee makers?
Search query: manual espresso machines
Prompt: Which manual espresso machines would you recommend?
Search query: best espresso machine under 500
Prompt: What’s the best espresso machine under $500?
Search query: automatic coffee machines
Prompt: What are the best automatic coffee machines?
We also keep the relevant modifiers. Price range, product type, use case, audience, and comparison criteria can significantly change the brands and sources included in an answer.
The goal is not to predict every possible way someone might phrase a question. That would be impossible. We need a consistent prompt sample based on real demand, relevant customer questions, and the decisions the business wants to influence.
Synthetic prompts are still synthetic. They do not become real prompt-volume data simply because they are well researched, but they give us a much stronger test set.
3. Run every prompt multiple times
AI answers are not consistent. That’s a feature, not a bug. The inherent variability, some level of randomness, is what makes large language models work.
A brand may appear in one response and disappear from the next. Its position may change and the cited sources may be different. Even the description of the same product or company can vary.
Because of this, running each prompt once is not enough. If we run a prompt once, we record an answer. But if we run it multiple times, we start measuring a pattern. All our measurements are about probability, not certainty.
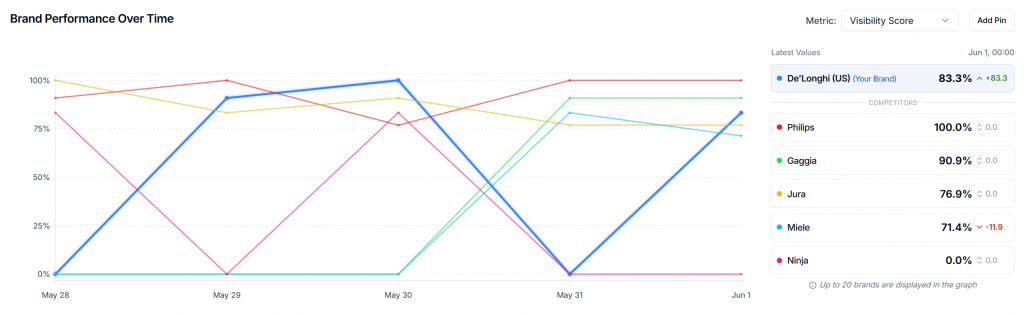
Repeated runs reveal how much brand visibility can vary between AI responses. A larger sample helps separate recurring patterns from one-off results.
For our monitoring setup, we run every prompt several times on each selected AI model. We use Rankscale to manage the synthetic prompt tracking and compare brand performance across repeated runs and monitoring periods.
A larger sample helps us distinguish a recurring result from a one-off answer.
Across those runs, we can measure:
- how frequently the brand is mentioned
- where it appears compared to competitors
- which sources receive citations
- how the brand is described (sentiment)
- and how these signals change over time
Collecting more answers does not eliminate all AI variability, but it makes the results more statistically accurate and directionally useful.
4. Choose which AI platforms to monitor
Tracking every available AI model is not necessarily the best starting point.
We first look at the platforms that already interact with the website or send measurable traffic.
Google Analytics can show AI referral sources such as ChatGPT, Gemini, or Perplexity when users reach the website through links in AI-generated answers.
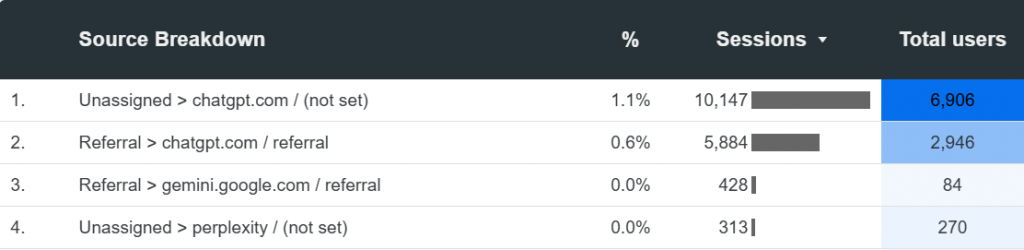
AI referral traffic in Google Analytics helps identify which platforms are already sending users to the website
Server logs provide another layer. They can reveal known AI user agents and show which AI crawlers are accessing the website.
These datasets answer different questions:
- Analytics shows which platforms are sending users.
- Server logs show which known AI systems are crawling or accessing the site.
But neither provides a complete picture on its own. Together they help us prioritize the platforms that are currently most relevant to the business.
The tracked model set can then expand as usage patterns, target markets, or platform relevance change.
5. Put AI visibility into business context
AI visibility is only one signal.
A higher mention rate looks good in a dashboard, but it does not automatically mean stronger brand growth or better business performance.
We also need to ask:
- Are people engaging with and sharing the content?
- Is the visibility increase a short-term burst or a longer-term reputation improvement?
- Are AI platforms sending relevant traffic?
- Does higher visibility correlate with conversions and profit?
Correlation does not automatically prove that AI visibility caused the result. But without connecting visibility data to other performance signals, we are left with another isolated metric.
The purpose of monitoring is not just to show that the brand appeared in an AI answer. We need to understand where it appears, how it compares to competitors, what information shapes the answer, and whether changes in visibility correspond with meaningful business outcomes.
Analysis leads to action
AI visibility monitoring is a sampling problem first and an interpretation problem second.
A useful setup starts with existing demand data and real customer questions. It turns them into realistic prompts, runs those prompts enough times to identify consistent patterns, and monitors the AI platforms that matter to the business.
The results then need to be read alongside traffic, engagement, conversions, and profit. This is also how we approach SEO today, as a broader visibility system that connects traditional search, AI-driven discovery, and business performance.
If you are setting up AI visibility monitoring and want to compare your current approach with ours, or if you’re just getting ready to start your AI visibility optimization – get in touch by filling out the form below. We can help you build a prompt set and monitoring workflow grounded in your market, customer questions, and business priorities.
Looking for more practical SEO workflows? Explore our SEO insights 👇