


They assisted with setting up digital marketing controls and reporting, PR monitoring, and paid advertising support, which helped us improve our ability to track campaign performance and better inform our decision-making.
Client
Museum of Illusions
Expertise
- Google Reviews Monitoring
- AI-Powered Sentiment Analysis
- Multi-Location Performance Tracking
- Review Trend Detection
- Operational Intelligence
- Topic-Level Feature Extraction
Year
2025 - 2026

Museum of Illusions operates 60+ locations across 28 countries, generating thousands of Google reviews monthly. As a location-based entertainment brand, reviews are one of the highest-impact touchpoints in the customer decision journey, yet until now, there was no unified system to monitor, analyze, or act on them across the network.
Client words
Over the past year, Granular has worked with us to support the development of a more structured and data-informed digital marketing approach. They assisted with setting up digital marketing controls and reporting, PR monitoring, and paid advertising support, which helped us improve our ability to track campaign performance and better inform our decision-making.
Their work in implementing tracking and reporting tools contributed to a clearer understanding of our marketing data and operational efficiencies, resulting in a more efficient and effective output overall.
The collaboration has been professional and we consider Granular as an extension of our team as we continue to refine and grow our marketing processes.
Ryan Saddik, Global Director of Marketing

Challenges
No Centralized Review Visibility
With over 10 active locations generating reviews independently, there was no single place to monitor review performance across the network. Each location’s Google Business Profile existed in isolation, making it impossible to compare performance, spot emerging issues, or identify which locations were excelling. Leadership had no consolidated view of how the brand was being perceived across markets.
Reviews Were Read, Not Analyzed
Individual reviews were occasionally read and responded to, but there was no systematic analysis of what customers were actually saying. Patterns across hundreds of reviews — recurring complaints about pricing, praise for specific exhibits, frustrations with wait times — remained buried in unstructured text. Without structured extraction, reviews were anecdotal rather than analytical.
No Early Warning System for Declining Locations
A location could experience a gradual decline in review quality over weeks without anyone noticing. By the time a rating drop became visible, the underlying issue had often been compounding for months. There was no mechanism to flag negative trends in real time or compare current performance against recent baselines.
Inability to Connect Reviews to Operational Topics
Even when reviews were read, there was no framework to categorize feedback into actionable operational categories. A review mentioning “not worth the price” and another saying “too expensive for what you get” were treated as isolated comments rather than signals within a “Pricing & Value” theme that could inform strategic decisions.
Response Management Lacked Accountability
Review response rates varied significantly across locations, with no visibility into which locations were responding promptly and which were leaving reviews unanswered. Given the direct impact of response behavior on Google ranking signals and customer perception, this gap carried real business consequences.

Solution
Centralized Multi-Location Review Dashboard
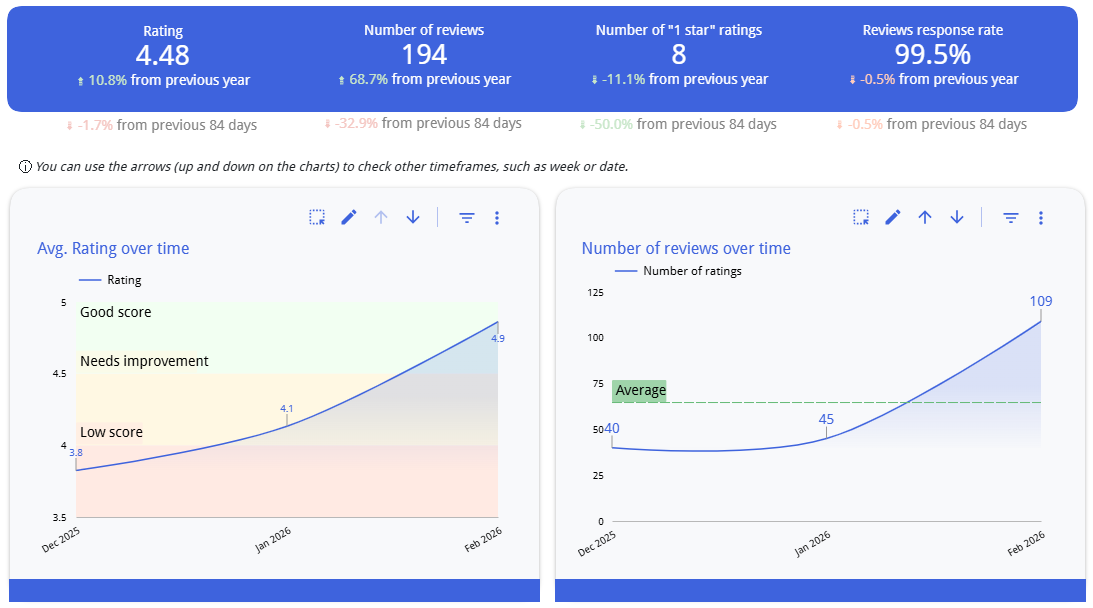
We built a unified monitoring system that aggregates Google review data across all tracked Museum of Illusions locations into a single dashboard. The system provides both an all-time cumulative view and rolling time-windowed analysis (last 14 months, last 30 days), enabling both strategic overview and tactical responsiveness.
Google Reviews Intelligence System – Trends
30-Day Trend Detection Engine
The dashboard automatically compares the most recent 30-day window against the prior 30-day period to surface changes in both rating and review volume. Each location receives a dynamically calculated status, flagging whether review trends are very positive, neutral, negative, or very negative, so that locations needing attention are immediately visible without manual analysis.
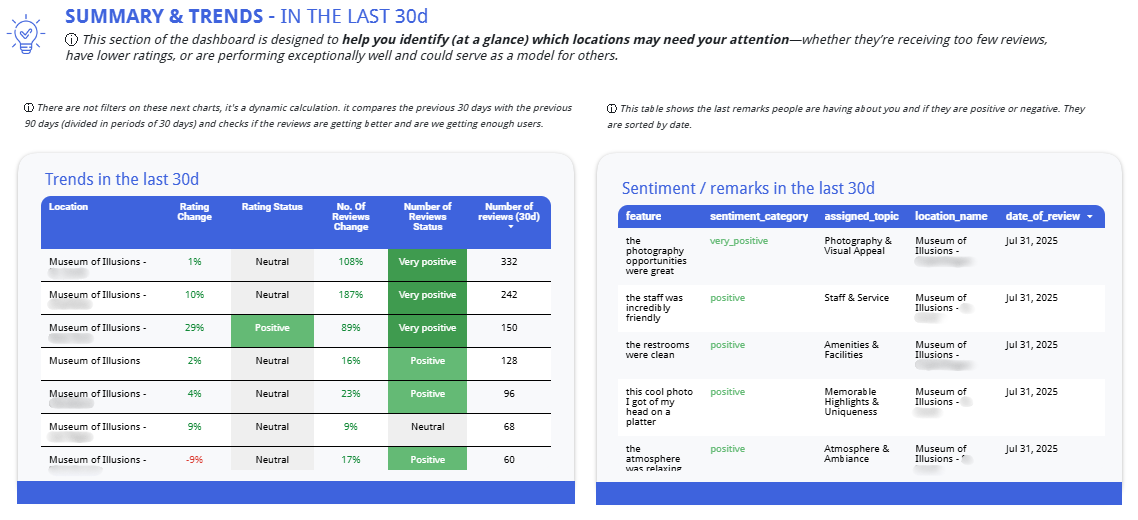
Trends in the last 30 days
LLM-Powered Sentiment and Feature Extraction
Every review is processed through a large language model pipeline that performs two key functions: it assigns a sentiment score (ranging from -1 to +1 across categories from very negative to very positive), and it extracts the specific feature or topic being discussed. This transforms unstructured review text into structured, queryable data.
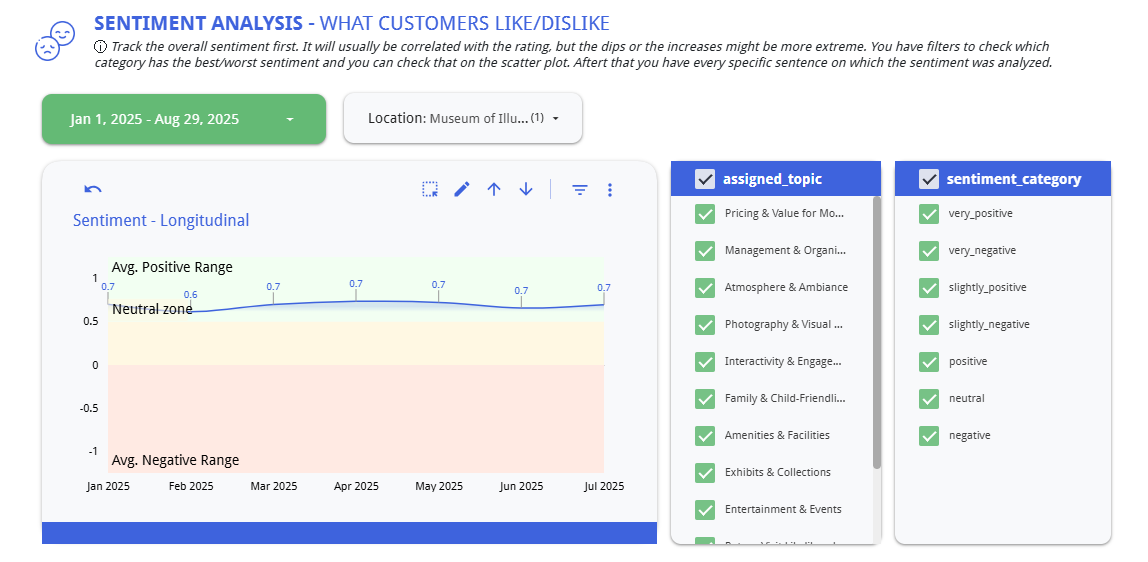
Sentiment Analysis
Topic Taxonomy for Operational Insights
Reviews are automatically classified into a predefined set of operational topic categories:
- Expectations & Experience
- Safety & Accessibility
- Pricing & Value for Money
- Management & Organization
- Atmosphere & Ambiance
- Interactivity & Engagement
- Exhibits & Collections
- Amenities & Facilities
- Photography & Visual Experience
- Family & Child-Friendliness
- Staff & Service
- Memorable Highlights
- Return Visit Likelihood
This taxonomy was designed to map directly to the operational levers MOI can actually control, ensuring that insights are immediately actionable.
Sentiment Distribution Visualization
A scatter plot visualizes each topic category by sentiment score and mention volume, with bubble size indicating frequency. This allows leadership to instantly identify which topics generate the most discussion and whether that discussion is positive or negative — revealing, for example, that “Family & Child-Friendliness” drives high volume with neutral sentiment (an improvement opportunity), while “Memorable Highlights” generates high volume with strongly positive sentiment (a brand strength to amplify).
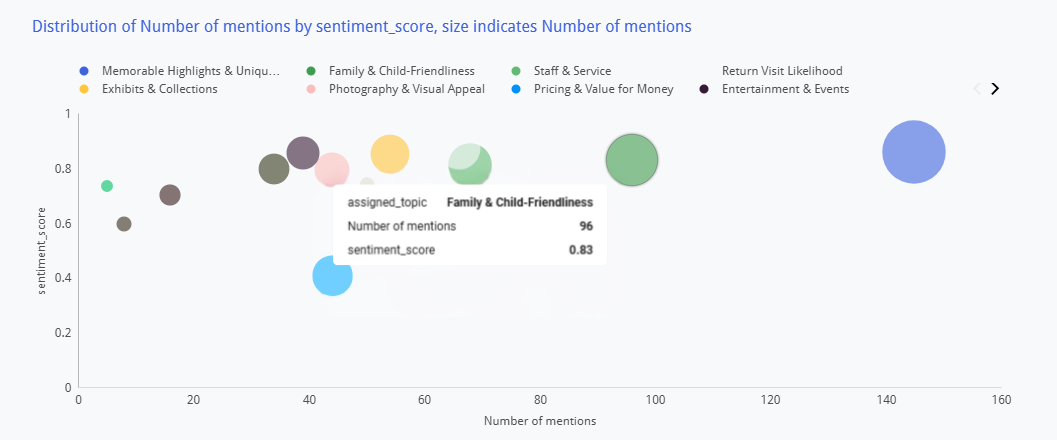
Sentiment distribution visualization
Review-Level Drill-Down
Beyond aggregated metrics, the system preserves access to individual review features — the specific sentence or phrase extracted from each review, its assigned topic, sentiment score, location, and date. This enables teams to move from macro trends to specific customer verbatims when investigating an issue or preparing operational recommendations.
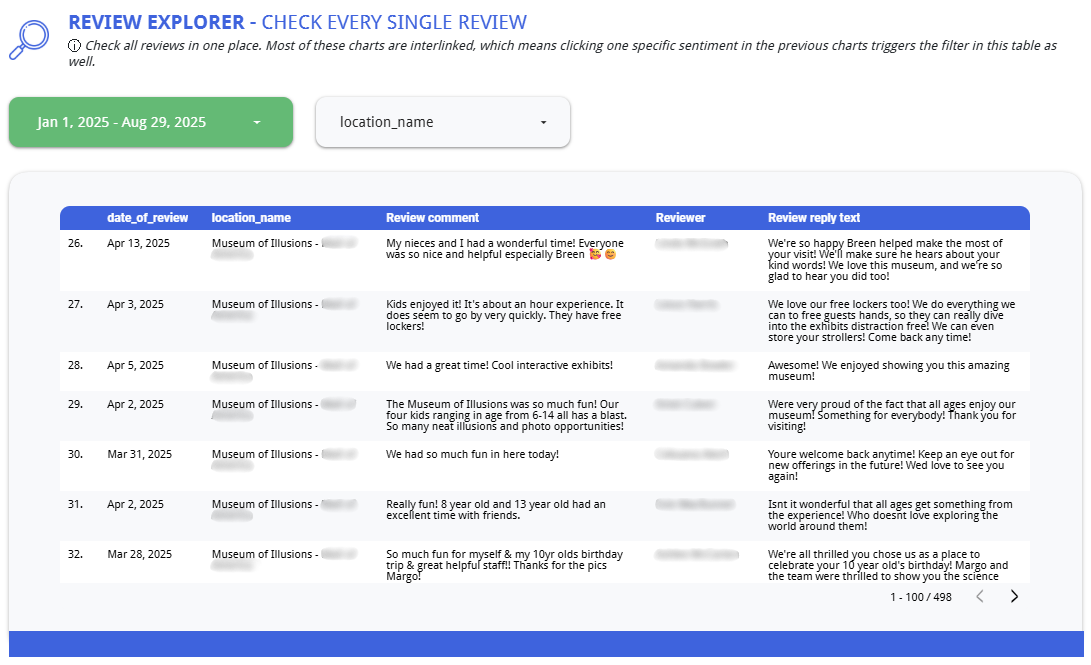
Review explorer

Results
- Unified Network Visibility All locations now report through a single review intelligence dashboard, enabling instant cross-location performance comparison and trend identification.
- Proactive Issue Detection The 30-day trend engine surfaces declining locations before rating damage becomes significant, shifting the approach from reactive to preventive.
- Operational Insight from Unstructured Data LLM-powered analysis converts thousands of reviews into structured topic-level sentiment data, revealing patterns invisible to manual review reading.
- Response Rate Accountability Tracking of review response rates across locations established clear visibility into which markets are managing their review presence and which require process improvements.
