


Their work in implementing tracking and reporting tools contributed to a clearer understanding of our marketing data and operational efficiencies, resulting in a more efficient and effective output overall.
Client
Museum of Illusions
Expertise
- Digital Performance Controlling
- Multi-Location KPI Tracking
- Advertising Budget Management
- Ticket Sales Monitoring
- Cross-Channel Signal Detection
- Plan vs. Actual Reporting
Year
2024 - 2025

Museum of Illusions operates 60+ locations across 28 countries, each generating data across ticketing systems, Google Analytics, Google Ads, Meta Ads, Google Business Profiles, and PR placements. As the network scaled, so did the complexity of understanding whether the business was on track — not eventually, but today. Leadership needed a system that could answer “how are we doing right now?” at the network level and for any individual location, without waiting for monthly reports or manually assembling data from a dozen different platforms.
Client words
Over the past year, Granular has worked with us to support the development of a more structured and data-informed digital marketing approach. They assisted with setting up digital marketing controls and reporting, PR monitoring, and paid advertising support, which helped us improve our ability to track campaign performance and better inform our decision-making.
Their work in implementing tracking and reporting tools contributed to a clearer understanding of our marketing data and operational efficiencies, resulting in a more efficient and effective output overall.
The collaboration has been professional and we consider Granular as an extension of our team as we continue to refine and grow our marketing processes.
Ryan Saddik, Global Director of Marketing

Challenges
No Single Source of Truth for Performance
Data lived in silos. Ticket sales sat in one system, GA4 data in another, ad spend in platform-specific dashboards, reviews on Google Business Profiles, and PR placements in agency reports. Answering a simple question like “how is the Atlanta location performing this month?” required pulling numbers from five or more sources, each with different time ranges, definitions, and formats. There was no unified view that connected business outcomes (visitors) to the digital signals that drive them.
No Plan-vs-Actual Tracking at the Location Level
Each location operates against visitor targets, but there was no automated way to track actual ticket sales against the plan on a daily or monthly basis. Fulfilment — whether a location was ahead or behind its target — was calculated manually and inconsistently. By the time underperformance was identified, weeks of the month had already passed, leaving little time to course-correct through marketing or operational adjustments.
Digital Metrics Were Disconnected from Business Outcomes
Website sessions, ad clicks, and impressions were reported in isolation from ticket sales. There was no framework for understanding which digital metrics actually served as leading indicators of visitor volume. Without this connection, marketing teams couldn’t distinguish between metrics that looked good in a platform dashboard but had no bearing on actual revenue, and those that genuinely predicted ticket sales.
Ad Spend Across Platforms and Locations Was Uncontrolled
With both Google Ads and Meta campaigns running across multiple locations, there was no centralized budget pacing view. Overspending at one location could go unnoticed while another location underspent its allocation. Daily and monthly pacing against budget targets required manual checks across each platform for each location, a process that was inconsistent and often delayed.
No Signal Detection for Emerging Problems
When a campaign started underperforming, a location’s review sentiment turned negative, or organic visibility dropped for key listicle placements, these issues surfaced slowly, often only during scheduled reporting cycles. There was no mechanism to flag anomalies in real time: year-over-year performance shifts, sudden changes in conversion rates, or trend reversals that warranted immediate attention.
Fragmented View of Brand Presence
Google Reviews, PR placements, and listicle visibility each contributed to a location’s brand presence in its local market, but these were tracked (if at all) in separate systems with no connection to each other or to commercial performance. A location’s declining review rating might coincide with a drop in ticket sales, but without an integrated view, these correlations remained invisible.

Solution
Tickets & Visitor Performance Module
The controlling system’s primary view tracks total ticket sales against planned targets across all locations. The default view presents year-to-date data aggregated across the network, with location filters enabling drill-down into any individual museum. A cumulative visitor chart shows the progression toward annual targets, while a monthly fulfilment view compares actual visitors against planned figures with any value above 100% indicating the target has been met.
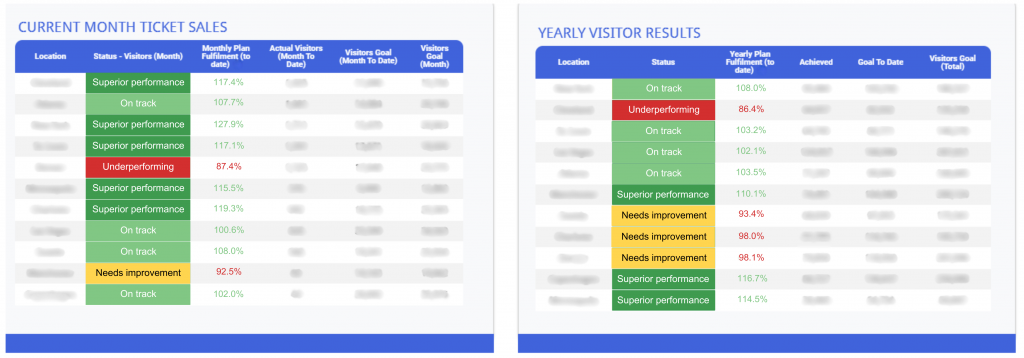
Digital Controlling System – Tickets & Visitor Performance Module
This is designed to be the first thing checked every morning: are we on track, per location, this month and this year?
Digital Metrics as Sales Predictors
Rather than reporting digital metrics in isolation, the system frames them as leading indicators of ticket sales. Scorecards display current values alongside year-over-year comparisons and a critical trend indicator: whether the last seven days are performing better, similarly, or worse than the previous year-over-year trend. This surfaces not just whether numbers are up or down, but whether the trajectory is improving or deteriorating; the difference between a temporary dip and a developing problem. Data is pulled directly from GA4 and advertising platforms, covering sessions, engagement, and conversion metrics.
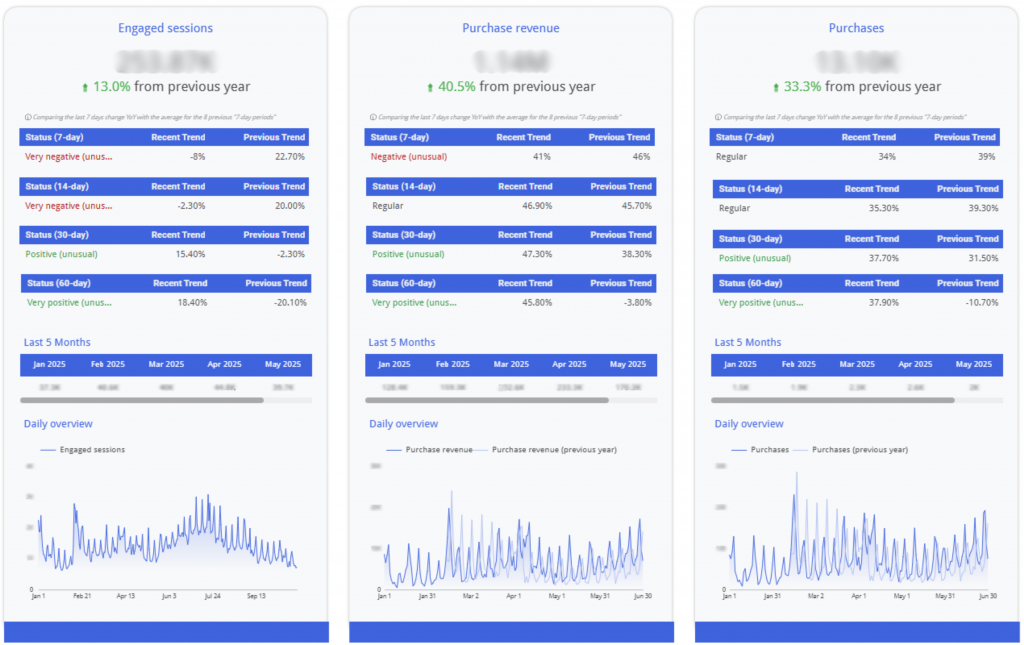
Digital Controlling System – Digital Metrics as Sales Predictors
These signals are continuously compared against actual ticket sales data to understand how changes in digital performance align with real revenue movements. The goal is not to claim direct causation, but to confirm that digital trends consistently reflect shifts in on-site results.
This turns digital metrics into an early signal layer, highlighting potential revenue movement before it fully materializes, instead of treating marketing data as a separate reporting stream.
Advertising Budget Pacing and Optimization
A dedicated budget tracking module consolidates Meta and Google Ads spend across all locations into a single pacing dashboard. The Summary view provides daily spend monitoring to catch overspending early and maintain budget alignment.
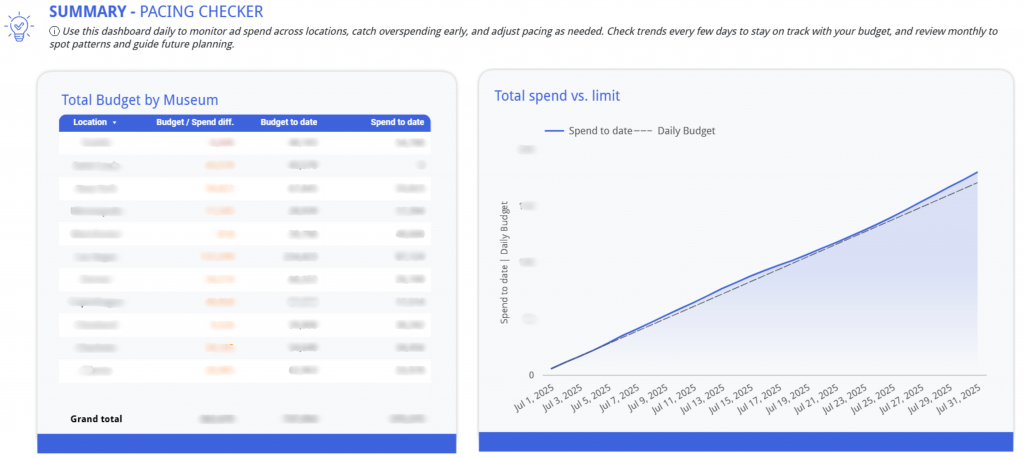
Digital Controlling System – Budget Tracker – Summary
The Explorer view goes deeper, surfacing real-time spend by channel and location with daily budget reallocation suggestions, enabling teams to rebalance across Google and Meta to stay on target and optimize performance without waiting for end-of-month reconciliation.
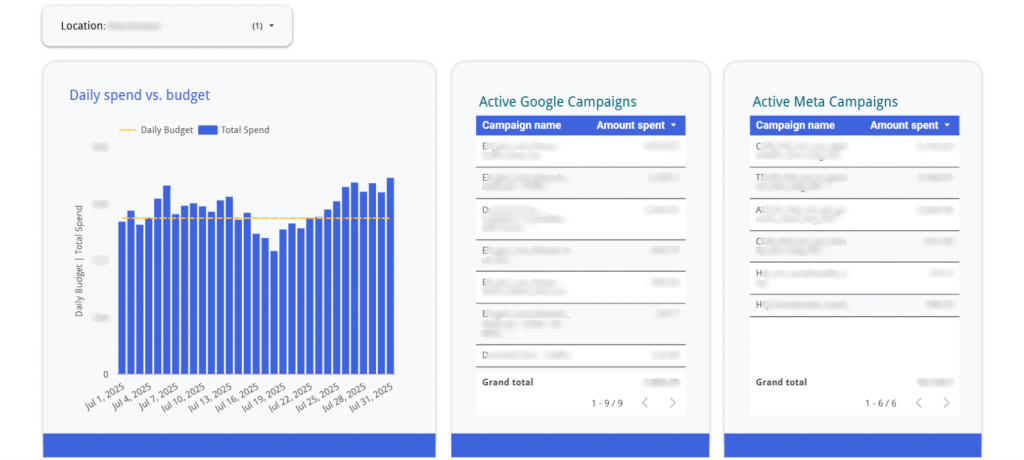
Digital Controlling System – Budget Tracker – Real-time spend by channel and location
Google Ads Signal Detection
For paid search specifically, the system implements an automated signal layer that flags campaigns, ad groups, and keywords requiring attention. It calculates year-over-year changes for the current month alongside month-over-month shifts, focusing specifically on conversion-based metrics for generic (non-branded) search terms. Nine scorecards provide an at-a-glance assessment across conversion metrics, visitor metrics, and awareness metrics. Below the scorecards, campaign-level tables with time-series charts enable drill-down into specific advertising levels to diagnose flagged issues.
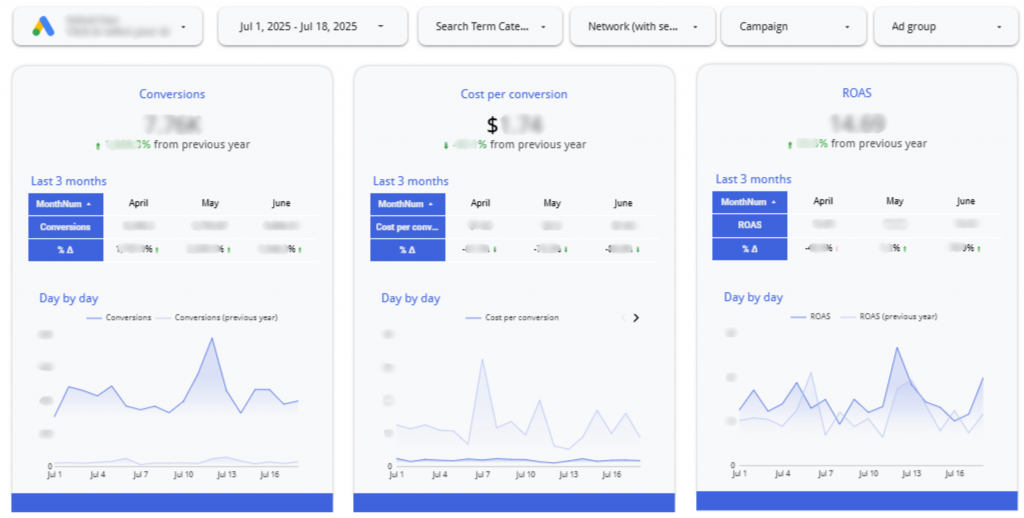
Digital Controlling System – Paid search conversion metrics
Integrated Review Intelligence
The Google Reviews tracking system feeds directly into the controlling dashboard, surfacing review trends, sentiment shifts, and response rates by location. This connects customer feedback to the same operational view where ticket sales and marketing performance are monitored so that a location showing declining visitor fulfilment can immediately be cross-referenced against its recent review trajectory.
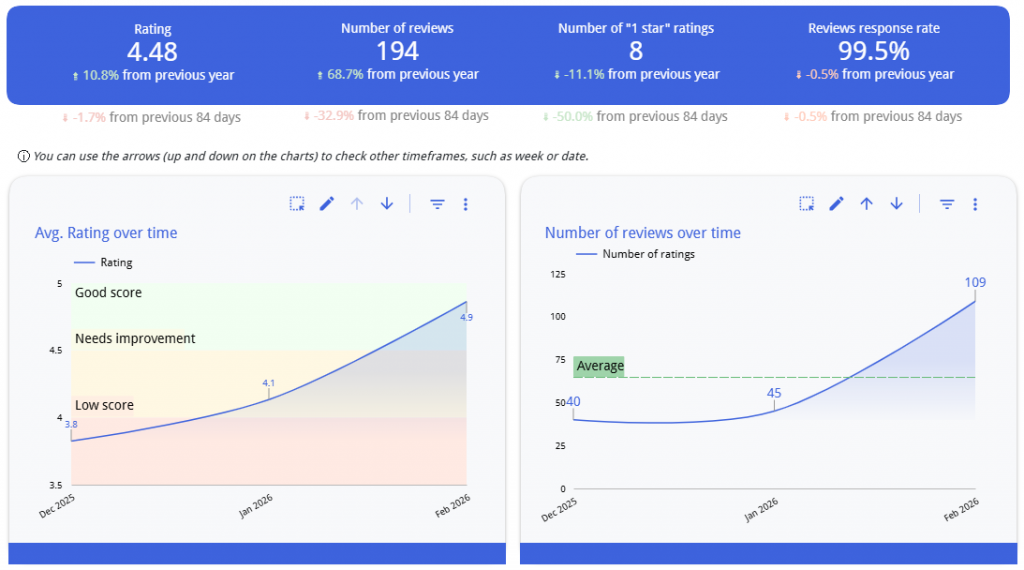
Review Intelligence System – Trends
PR and Listicle Visibility Tracking
The PR intelligence and SERP visibility systems also feed into the controlling framework. Listicle placements, their organic visibility over time, and PR article performance scores are accessible alongside commercial and advertising data, enabling leadership to evaluate whether earned media investments are contributing to overall location performance.
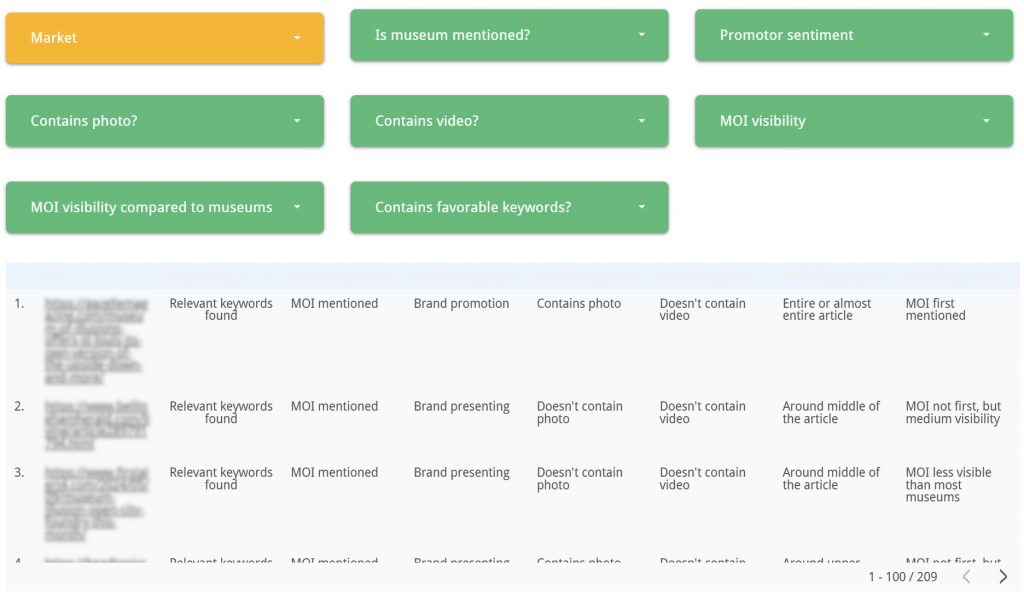
Digital Controlling System – PR Tracker

Results
- Single Morning Check Leadership can assess network-wide and location-level performance across tickets, digital channels, ad spend, reviews, and PR visibility in one dashboard — replacing a fragmented, multi-platform reporting process.
- Proactive Budget Control Daily pacing visibility across all locations and platforms enables budget reallocation before overspend or underspend becomes significant, with actionable suggestions surfaced automatically.
- Early Problem Detection Year-over-year and trend-based signal detection flags performance anomalies across advertising, digital metrics, and reviews — shifting the response from monthly reporting cycles to real-time awareness.
- Connected Performance View By bringing ticket sales, digital leading indicators, ad spend, reviews, and PR visibility into one system, correlations that were previously invisible — like declining reviews coinciding with falling visitor numbers — become immediately apparent.
