GRANULAR SOLUTIONS

Search Demand Forecasting

Maximize traffic and sales for the right categories, at the right time. See demand before it peaks, act before competitors react, and stop missing category trends your team should already be preparing for.

See what to prioritize next
 

Instead of planning based on past traffic, the highest search volume, or internal pressure, use a planning dashboard that connects demand signals, timing, competitive context, and commercial value into a clear category priority view.


Used across complex retail catalogs

Planeta Sport

Serbia’s largest sports retail chain, with 110+ stores across 60+ cities and a catalog shaped by overlapping sports seasons. The system gave the SEO team a forward-looking calendar for knowing which categories to prepare weeks before demand peaks, instead of reacting once traffic had already started moving.

Profitability-weighted priorities

SEO effort tied to revenue potential

See how we did this >
ePlaneta

One of Serbia’s leading online retailers, with 170,000+ products across 2,000+ categories. The system gave the team category-level demand visibility across a catalog too large to prioritize manually, helping them focus SEO work where demand, timing, and commercial value aligned.

Full-catalog demand visibility

2,000+ categories prioritized by demand signals

See how we did this >

Most teams spot demand too late

In multi-category retail, category demand fluctuates seasonally. Preparing for these windows takes weeks, but standard reports identify shifts only after they begin, leaving little time for effective preparation. Surfacing demand windows earlier provides teams the necessary lead time to plan and execute successfully.

Limited forward visibility

Most reporting describes what has already happened. For categories with seasonal or event-driven demand, this means decisions are made after the relevant window has started.

Fragmented demand signals

Search Console, Google Trends, and clickstream data each describe demand from a different angle and on a different scale. Used separately, they do not give teams a reliable planning view across the catalog.

Demand windows differ in width

Some categories distribute their annual demand evenly. Others concentrate most of it into a few weeks. Standard tools rarely separate the two.

Volume ≠ priority

The biggest categories are not always the next best opportunity. Timing, demand concentration, competition, margin, and revenue potential need to be evaluated together.

Know which categories to act on next

Search Demand Forecasting connects search, SERP, trend, and business signals into a planning view that shows which categories are approaching demand windows, which ones have already passed their peak, and which emerging opportunities need fast action.

You can prioritize actions based on a combination of optimal timing, competitive landscape, and commercial potential.

This real-time visibility has enabled our teams to optimize campaigns swiftly, fine-tune content, and maintain steady conversion gains across the board.

Branimir Kulašević, Chief Ecommerce Officer at ePlaneta

Hit your category targets

What your team gets


Search Demand Forecasting is delivered as a working planning setup your team can use across category, content, SEO, merchandising, and commercial planning. It includes the dashboard views, priority logic, timing signals, and recurring briefs needed to turn category demand into action.

01 Planning dashboard

A single interface with category-level trajectories, recommended start dates, opportunity scores, competitive difficulty, and priority views across the catalog.

02 Demand-based planning calendar

A calendar view that shows when each category is expected to enter its demand window and when preparation work should start.

03 Category priority queue

A ranked view of categories based on timing, opportunity, demand concentration, commercial value, and competitive context.

04 Timing and concentration view

A view that separates categories with broad, gradual demand from categories where most of the opportunity is packed into a narrow window.

05 Recurring priority briefs

Per-category or period-based briefs that translate the dashboard into recommended actions for SEO, content, merchandising, paid, or commercial teams.

Common use cases

1.
Seasonal category planning

Categories peak at different points in the year, and the team needs visibility on which one is approaching its window next.

2.
Multi-category prioritization

The catalog is too large to address simultaneously, and the team needs a structured basis for deciding what to work on first.

3.
Content roadmap planning

Content investment should follow projected demand rather than past performance, static keyword lists, or internal assumptions.

4.
Commercial campaign alignment

Organic, paid, content, and merchandising activity need to be coordinated around shared demand windows or commercial periods.

5.
Emerging trend detection

The team needs to identify new opportunities without a historical baseline, before competitive density increases.

6.
Demand monitoring across the catalog

Ongoing visibility into category-level demand shifts is needed across a large catalog.

Where the system fits well

Business fit

Multi-category e-commerce, retail, marketplaces, and content-heavy publishers with a large catalog of categories or topics. Common fits include sports retail, fashion, garden, baby, hobby, DIY, auto, and beauty. Less relevant in categories where demand is largely flat across the year.

Demand fit

Brands where demand varies meaningfully across the calendar, driven by seasons, weather, sports cycles, school calendars, holidays, tournaments, or product launches. The system is most useful when a meaningful share of the catalog shows seasonal or event-driven variation.

Team fit

In-house marketing, content, e-commerce, and SEO teams that own organic execution and have the capacity to act on a prioritized planning view. Most relevant for teams large enough to run structured planning cycles and small enough that prioritization is a recurring constraint.

Capture more sales from categories with rising demand

Talk to us

System architecture

The system runs in four layers.

1. Data

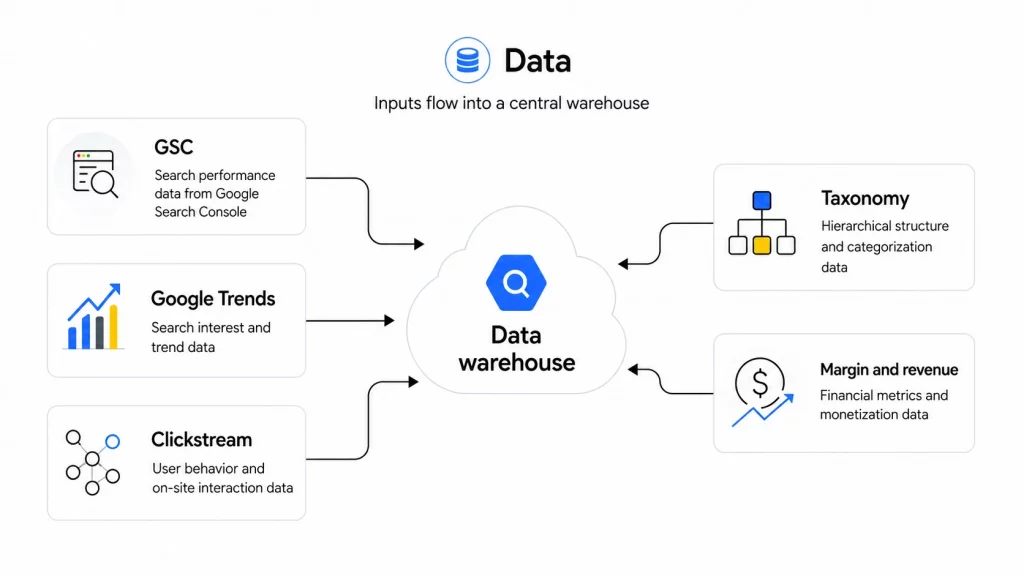
A BigQuery warehouse uses native Search Console bulk export, preserving history beyond the 16-month limit. Google Trends, clickstream, and internal commercial data (taxonomy, margin, revenue) are integrated and normalized on a common time axis.

2. Modeling

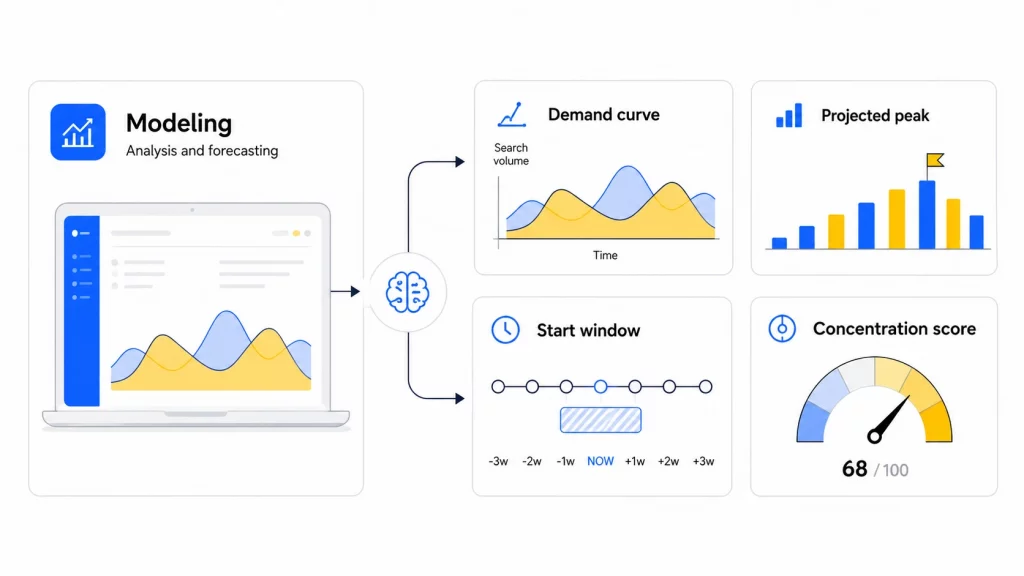
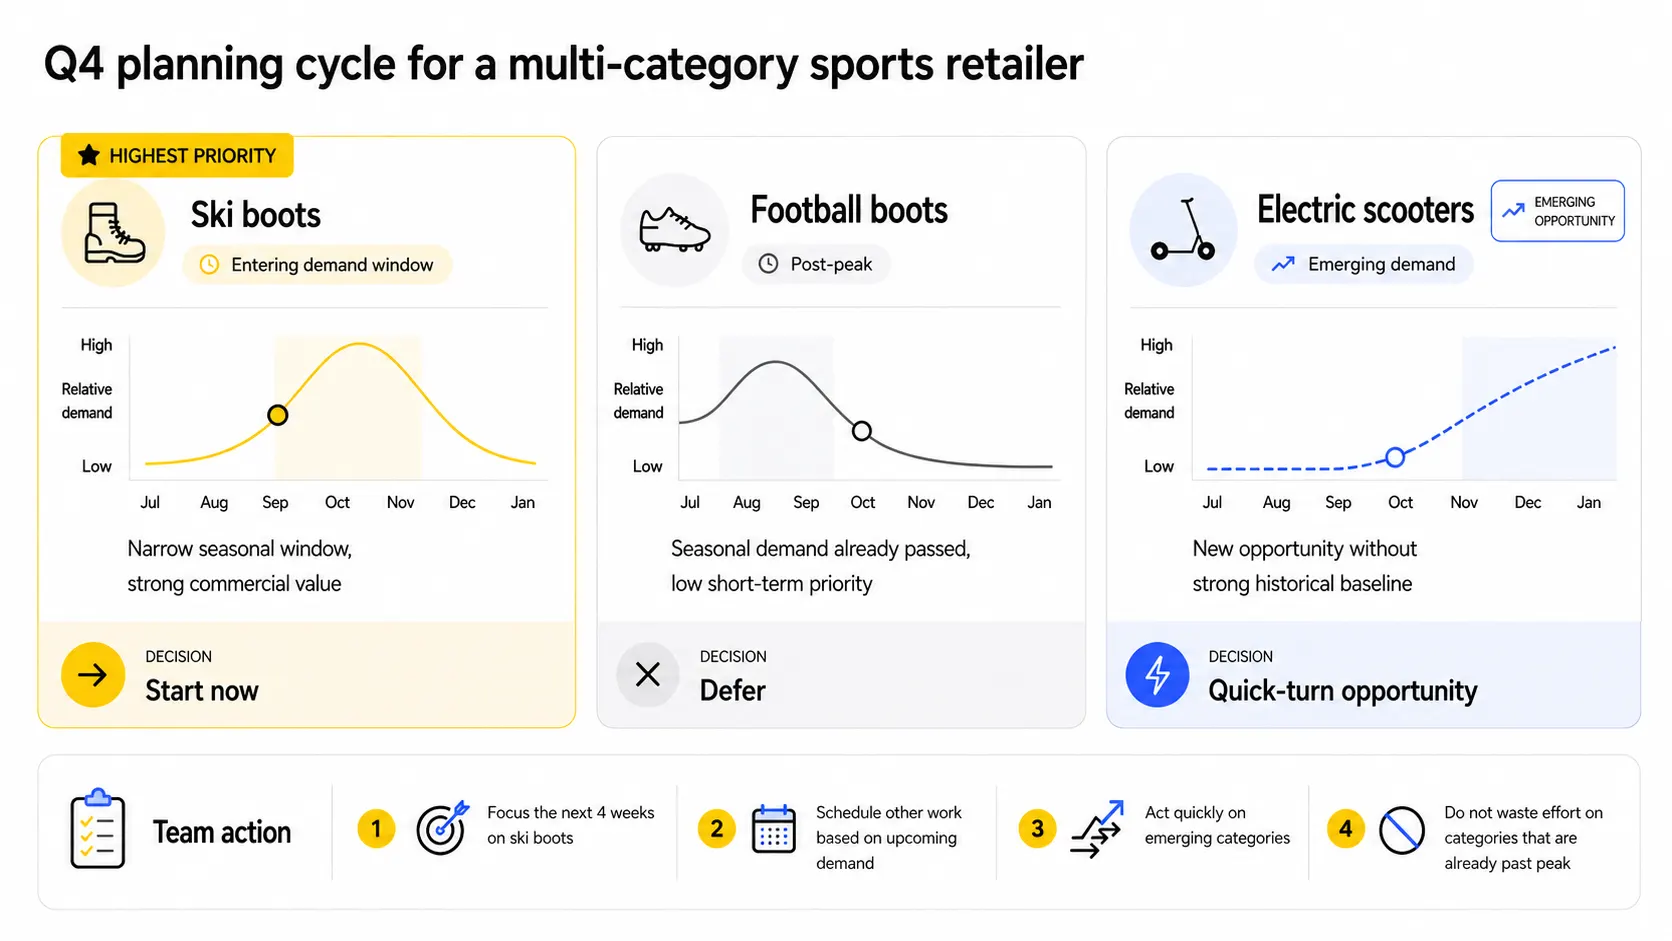
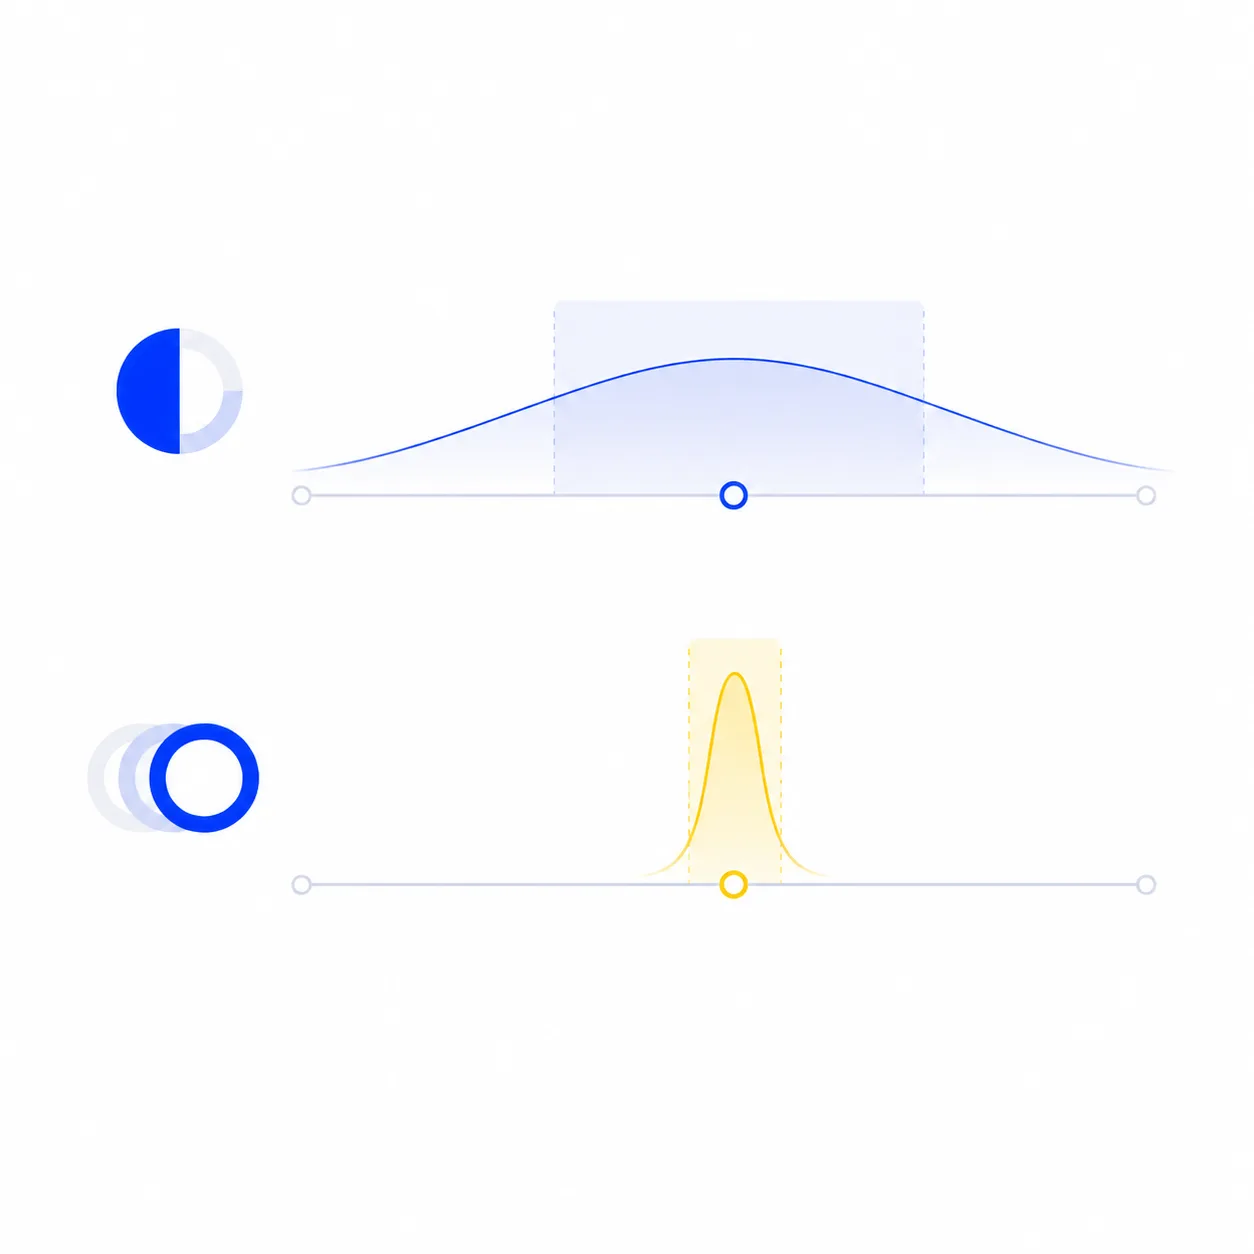
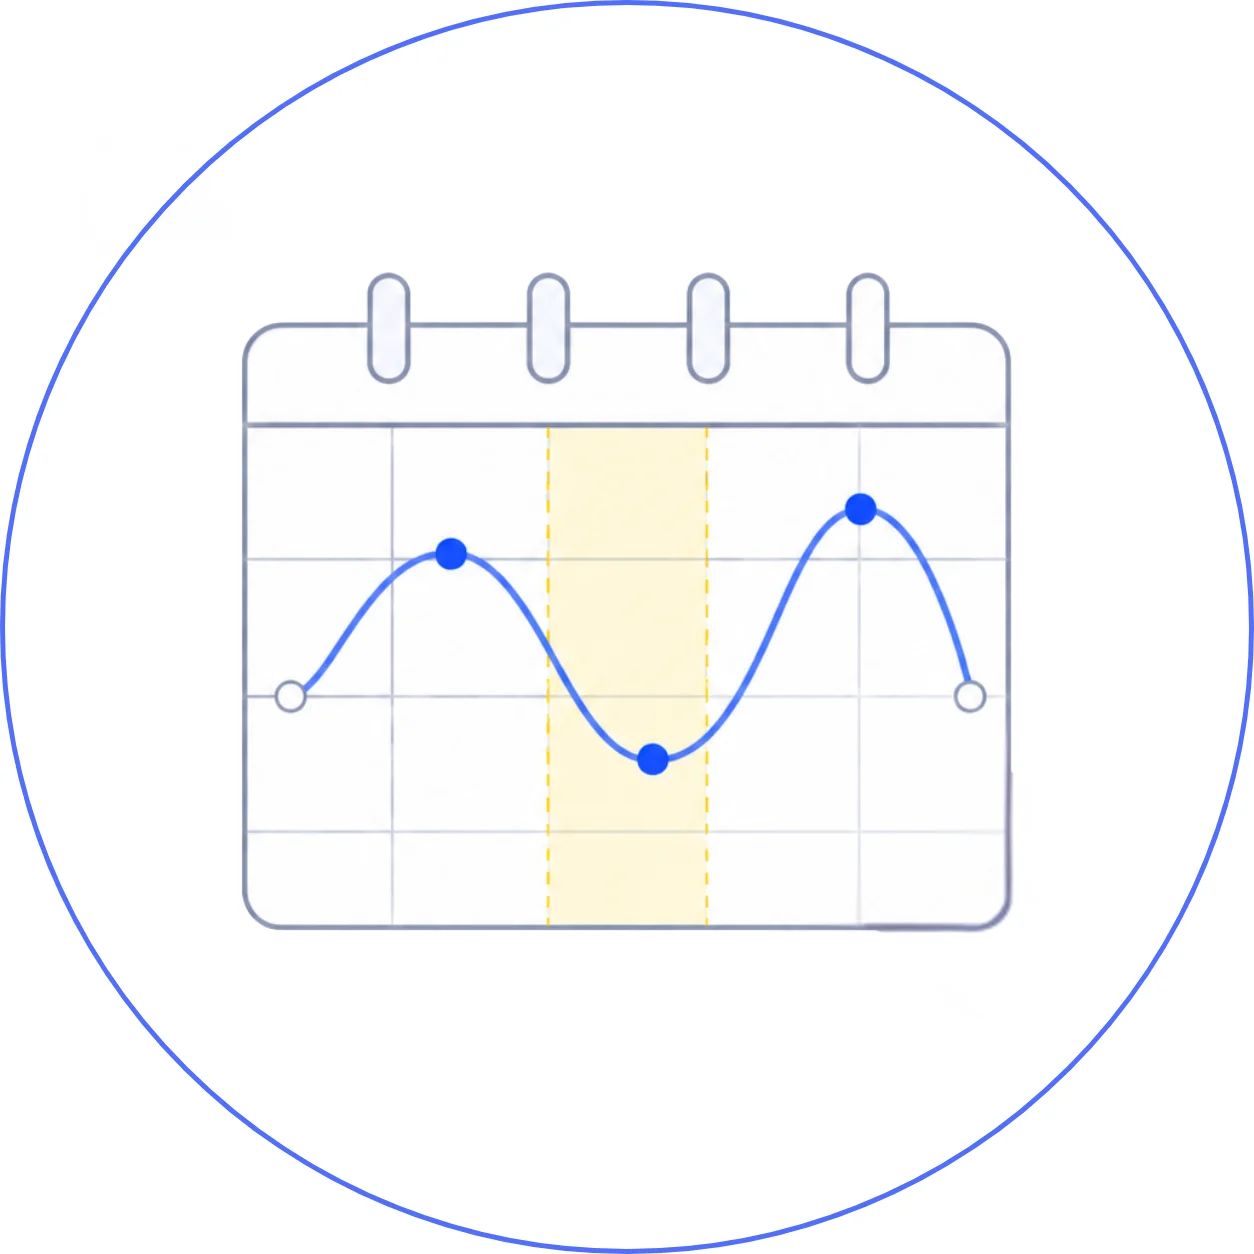
The model calculates category demand trajectories and identifies seasonal start dates. It also distinguishes between narrow and broad demand windows using a dedicated concentration metric.

3. Intelligence

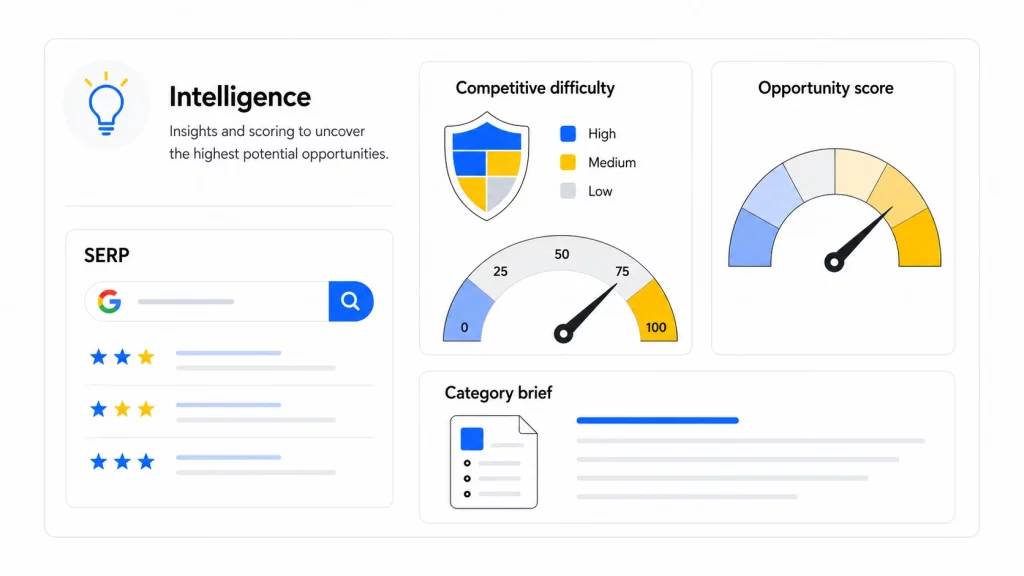
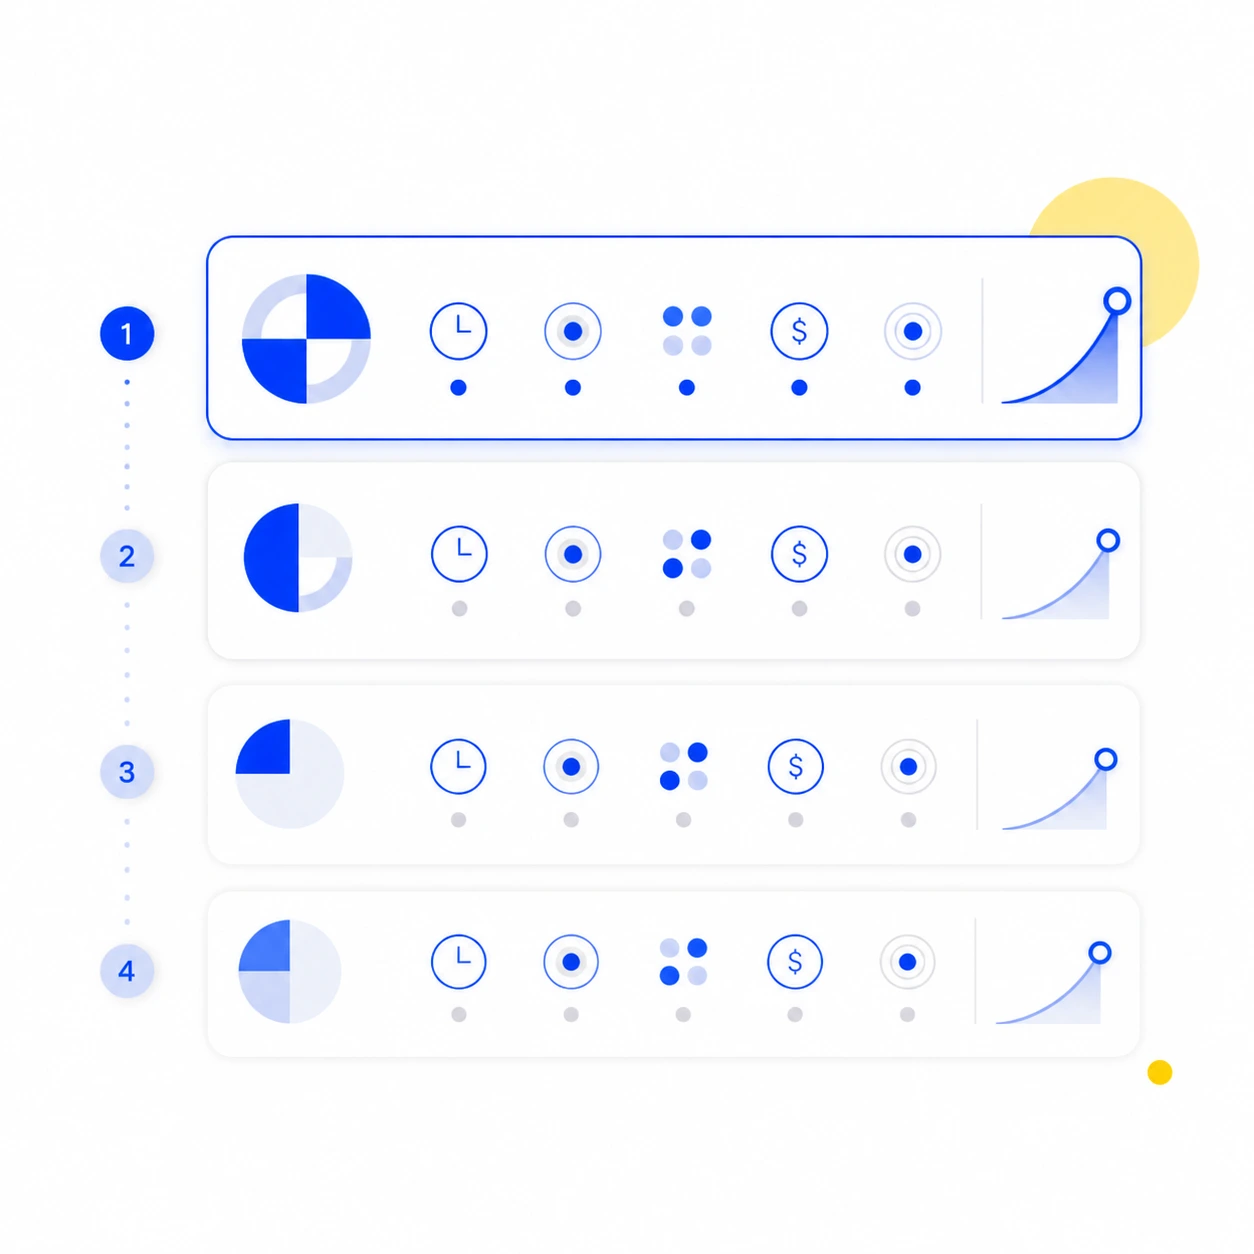
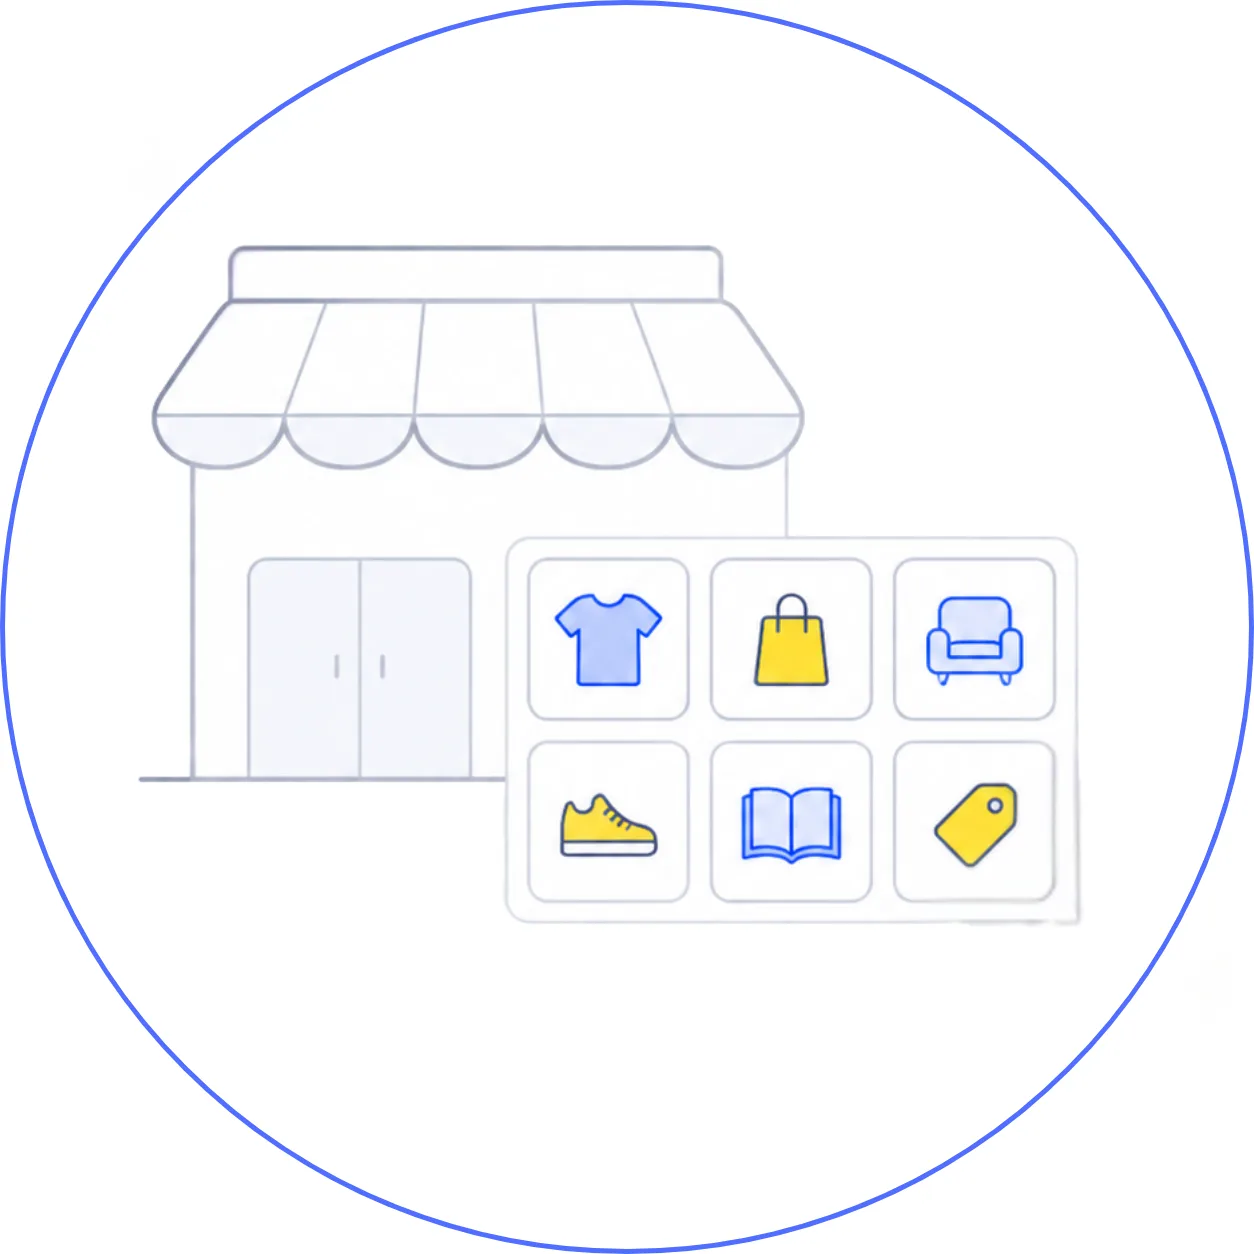
Automated SERP analysis runs on the top-10 results per category, evaluates competitive positioning, identifies visibility gaps, and produces per-category briefs. Margin and revenue data feed into the composite Opportunity Score.
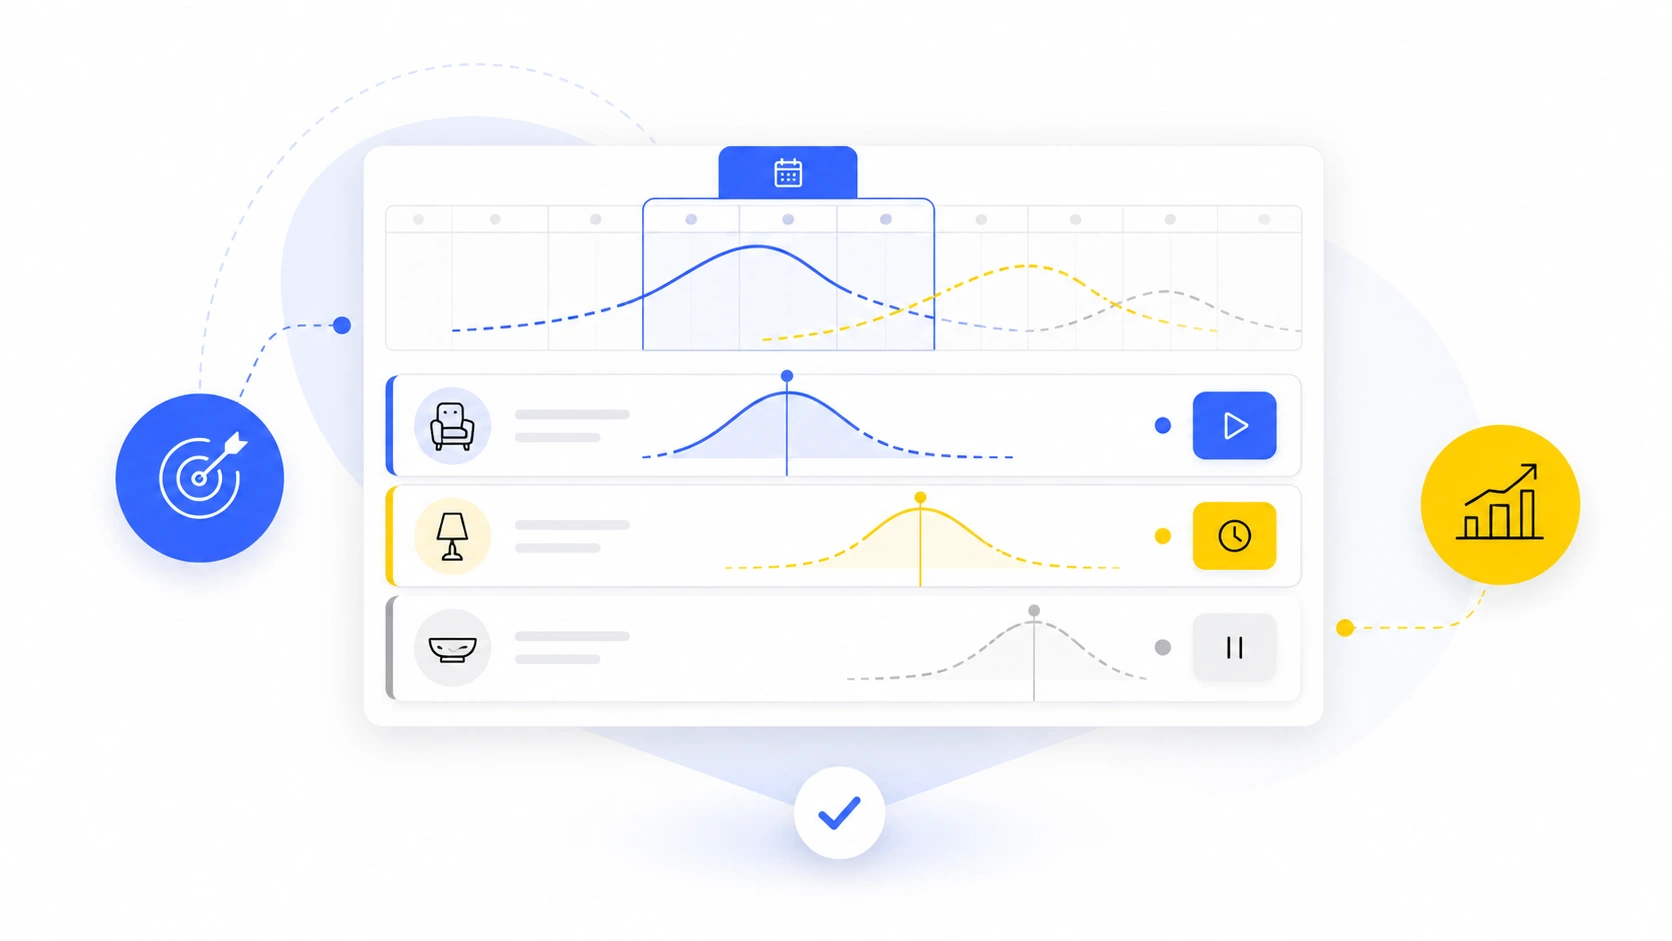
4. Output

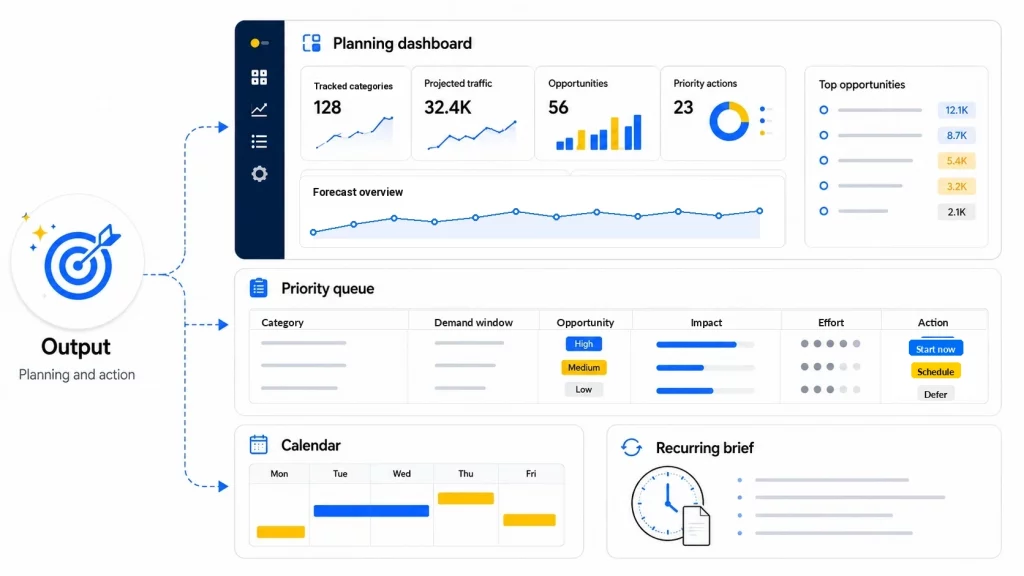
The final result is an easy-to-use dashboard. It lets you sort categories by demand trends, urgency, and how hard it is to compete. The system keeps learning and updating as new data comes in.


How this is set up and delivered

What Granular delivers

  • System architecture, BigQuery warehouse setup, and native GSC bulk export configuration
  • Trends, clickstream, taxonomy, and commercial data integration with normalization
  • Demand trajectory, window concentration, and commercially weighted opportunity scoring models
  • Automated SERP analysis, competitive context, and category-level priority logic
  • Planning dashboard, recurring briefs, team enablement, and ongoing model calibration

What the client provides

  • Search Console access at admin level
  • Internal category taxonomy and product catalog mapping
  • Category-level margin and revenue data, where available
  • A point of contact in commercial or finance for data alignment
  • A team capable of acting on prioritized output

Delivery format

  • Persistent BigQuery warehouse
  • Planning dashboard (Data Studio or equivalent)
  • Recurring priority briefs
  • Integration into quarterly roadmap reviews, monthly editorial planning, and weekly standups

Frequently asked questions

How much historical data is needed?

One full annual cycle is enough to begin producing useful results. Two years is the point at which predictions become consistently strong. Three years and beyond is where they become sharpest, particularly for categories influenced by tournament cycles, weather variability, or shifting school calendars. The warehouse begins compounding from day one regardless of starting depth.

Can this work without margin data?

Yes. Demand modeling, window concentration, and SERP analysis run independently. Margin weighting is the layer that translates visibility into commercial prioritization. Without it, the system functions as a planning tool. With it, the planning is aligned to P&L.

Why can't an in-house analyst do this with GSC and Trends?

Partially, they can. The 16-month GSC retention limit breaks year-over-year baselines after the first cycles. Mapping Trends and clickstream onto an internal taxonomy is the most underestimated part of the work. And no off-the-shelf tool combines window concentration scoring, margin weighting, and SERP difficulty in a single view. The capabilities exist in fragments. The integration is what the system delivers.

Does this replace the strategy?

No. The system informs strategy by indicating which categories deserve attention and when. Execution remains with the client’s existing teams, in-house or external.

How often is the model updated?

Demand data refreshes daily as GSC flows in. Trajectory models recalibrate continuously. SERP snapshots refresh weekly per category, with on-demand refresh available for priority categories. Emerging-topic detection runs continuously.

Can it detect non-seasonal opportunities?

Yes. The emerging-topic layer identifies queries with no historical precedent and treats them as a separate priority queue.

What does the final output look like?

A planning dashboard with category-level trajectories, recommended start dates, opportunity scores, and competitive difficulty, alongside per-category briefs that include top keywords, current rankings, and recommended actions.

Can it be adapted to different category structures?

Yes. The system is mapped to the client’s internal taxonomy rather than imposing one. Aligning external data sources to that taxonomy is part of the implementation work.

See where demand is moving before your next planning cycle

If your team is still choosing priorities from past traffic, volume, or internal pressure, send us the context. We’ll help you see whether this system fits your catalog and planning cycle.